Markets don’t move solely because of earnings reports or economic news—they move because of emotion. The fear greed index is one of the most widely used tools for measuring that emotion, revealing whether investors are fearful and defensive or aggressive and risk-taking in their approach to markets.
Understanding the fear greed index makes it extremely useful for timing entries and exits, identifying bubbles or panic selling, understanding market volatility patterns, and reducing emotional decision-making. Rather than relying purely on fundamental or technical analysis, the fear greed index provides insight into the psychological forces driving price movements—forces that often override rational assessment of value.
Tracking sentiment alongside actual price movements through resources like our live gold price chart helps investors understand when fear-driven flows into safe havens create opportunities versus when greed-fueled rallies warrant caution.
What Is the Fear Greed Index
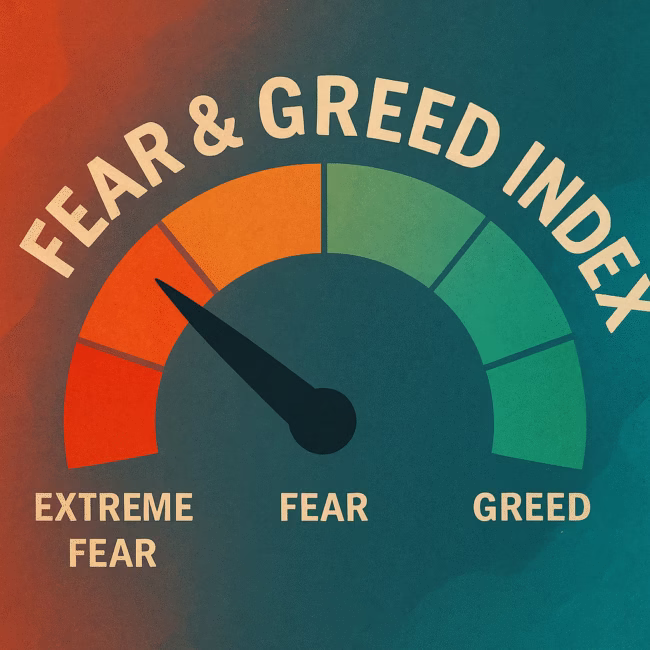
The fear greed index is a numerical score from 0 to 100 that quantifies the emotional state of the market based on multiple indicators that measure investor behavior, volatility, and market momentum.
Index Levels and Interpretation
| Score Range | Sentiment | Typical Market Behavior |
|---|---|---|
| 0–24 | Extreme Fear | Panic selling, flight to safety, oversold conditions |
| 25–49 | Fear | Defensive positioning, reduced risk-taking, pessimism |
| 50–74 | Greed | Risk-on behavior, optimism, FOMO beginning |
| 75–100 | Extreme Greed | Euphoria, overvaluation ignored, bubble conditions |
Popular Versions
Two primary implementations of the fear greed index serve different markets:
- CNN Fear & Greed Index: Focuses on U.S. stock markets, updated daily based on seven market indicators
- Alternative.me Crypto Index: Tracks cryptocurrency sentiment using different metrics suited to crypto market dynamics
Both measure the same psychological phenomenon—investor emotion—but adapt their methodologies to suit the specific characteristics of their respective markets.
How the Fear Greed Index Works
The fear greed index isn’t random or subjective—it’s calculated from several quantifiable market indicators that combine momentum, volatility, demand patterns, and investor behavior into a single composite score.
Main Components of the Stock Market Fear Greed Index
According to methodology documented by CNN Business, the fear greed index for stocks incorporates seven factors:
1. Market Momentum
Compares the S&P 500 against its 125-day moving average. When the index trades significantly above this average, greed is indicated; below suggests fear.
2. Stock Price Strength
Evaluates how many stocks hit 52-week highs versus 52-week lows on the New York Stock Exchange. More highs than lows indicates greed; the reverse signals fear.
3. Stock Price Breadth
Analyzes the volume of advancing stocks versus declining stocks. Strong advancing volume with many stocks participating indicates greed; declining volume dominance suggests fear.
4. Put/Call Ratio
Measures whether investors are buying protective puts (fear) or speculative calls (greed). A put/call ratio above 1.0 typically indicates fear; below 0.7 suggests greed.
5. Market Volatility (VIX)
Uses the CBOE Volatility Index. Elevated VIX readings (above 20) indicate fear as investors expect larger price swings. Low VIX (below 12) suggests complacency and greed.
6. Junk Bond Demand
Measures the spread between yields on junk bonds versus safe government bonds. Narrow spreads indicate investors are willing to take risk (greed); wide spreads show risk aversion (fear).
7. Safe-Haven Demand
Compares returns of stocks versus safe assets like gold and Treasury bonds. When stocks outperform significantly, greed dominates; when safe havens outperform, fear prevails.
Together, these factors reveal whether investors are collectively seeking safety or embracing risk—the fundamental dynamic driving the fear greed index.
Why Investors Use the Fear Greed Index
The fear greed index provides practical advantages that complement traditional fundamental and technical analysis approaches.
Avoiding Emotional Decisions
Behavioral finance research from Morningstar consistently shows that investors tend to sell during panic (locking in losses) and buy during euphoria (paying peak prices). The fear greed index helps investors recognize when they’re being swept up in collective emotion rather than making rational decisions.
When the fear greed index shows Extreme Fear, it prompts the question: „Am I selling because fundamentals changed, or because everyone else is panicking?“ Similarly, Extreme Greed readings ask: „Am I buying because value is compelling, or because I’m afraid of missing out?“
Identifying Market Extremes
The fear greed index excels at highlighting when markets have moved to emotional extremes that typically don’t persist:
- Extreme Fear (0-24): Often signals oversold conditions where quality assets trade below intrinsic value due to indiscriminate selling
- Extreme Greed (75-100): Frequently precedes corrections as overvaluation, excessive leverage, and unrealistic expectations create fragile conditions
According to historical analysis, markets rarely stay at extreme fear greed index levels for extended periods. Mean reversion tends to occur as emotion gives way to more rational assessment of fundamentals.
Improving Entry and Exit Timing
A simple contrarian strategy based on the fear greed index suggests:
- Consider adding to positions when others panic (Extreme Fear)
- Consider trimming positions when markets get euphoric (Extreme Greed)
- Hold steady during neutral readings (middle ranges)
This approach aligns with Warren Buffett’s famous advice to „be fearful when others are greedy, and greedy when others are fearful“—the fear greed index simply quantifies when those conditions exist.
Practical Applications Across Asset Classes
The fear greed index has utility beyond just stock market timing, providing insights applicable to various investment decisions.
During Market Pullbacks
When the fear greed index drops into Extreme Fear territory, it indicates markets may be oversold. Historical data shows that buying when the index reaches 0-20 often produces favorable long-term returns as fear-driven selling creates bargains.
However, timing exact bottoms remains difficult. The fear greed index can stay at extreme levels for weeks during genuine crises. Smart use involves scaling into positions gradually as fear persists rather than trying to catch the exact low.
During Market Rallies
Extreme Greed readings (75-100) on the fear greed index frequently appear before short-term corrections. While markets can remain irrational longer than investors expect, elevated readings serve as warnings that risk is elevated and profit-taking may be prudent.
This doesn’t mean selling everything—but it does suggest tightening stop losses, reducing leverage, or taking some profits off the table to lock in gains before potential reversals.
For Gold and Safe-Haven Assets
The fear greed index has particular relevance for gold investors. When the index shows rising fear, money typically flows into safe-haven assets including gold, driving prices higher. Conversely, extreme greed often coincides with gold weakness as investors rotate into risk assets.
Understanding this relationship helps gold investors time accumulation. Building positions during periods when the fear greed index shows greed (and gold prices are weak) often produces better risk-adjusted returns than chasing gold during fear-driven rallies. For portfolio planning that accounts for these sentiment-driven flows, tools like our portfolio investment calculator help model how gold allocations perform under different market sentiment scenarios.
For Cryptocurrency Markets
The crypto-specific fear greed index from Alternative.me uses different metrics suited to cryptocurrency markets:
- Volatility (25% weight)
- Market momentum and volume (25% weight)
- Social media sentiment (15% weight)
- Bitcoin dominance (10% weight)
- Google Trends data (10% weight)
Crypto sentiment swings more violently than traditional markets, with the fear greed index often moving from extreme fear to extreme greed within weeks. This creates both opportunity and risk—positions sized appropriately can capitalize on emotional overreactions, but overleveraging during volatile sentiment periods proves dangerous.
Limitations and Misconceptions
Despite its utility, the fear greed index has limitations that users should understand to avoid misapplication.
Not a Standalone Signal
The fear greed index measures sentiment, not value. Markets can remain at Extreme Greed for extended periods during genuine bull markets where rising prices reflect improving fundamentals rather than just emotion. Similarly, Extreme Fear can persist during legitimate crises where concern is justified.
According to research from Investopedia, the fear greed index works best when combined with fundamental analysis, technical analysis, and understanding of economic conditions rather than used in isolation.
Timing Precision
The fear greed index identifies emotional extremes but doesn’t pinpoint exact turning points. Markets can become more extreme before reversing—a reading of 10 can drop to 0, and a reading of 90 can climb to 100. Using the index requires patience and willingness to act gradually rather than all-at-once.
Different Market Environments
The fear greed index behaves differently during secular bull markets versus bear markets. In strong bull markets, the index spends more time in greed territory without corrections. In bear markets, fear readings can persist for months. Context matters for interpretation.
How to Incorporate the Fear Greed Index Into Your Strategy
Rather than trading based solely on fear greed index readings, sophisticated investors use it as one input among many in their decision-making process.
Establish Personal Thresholds
Define specific actions triggered by fear greed index levels:
- Below 20: Consider adding to core long-term holdings
- 20-40: Maintain current positions, watch for opportunities
- 40-60: Neutral—focus on portfolio rebalancing
- 60-80: Take partial profits on positions with large gains
- Above 80: Reduce leverage, tighten stops, raise cash levels
These thresholds should align with personal risk tolerance and investment timeframe rather than being rigidly mechanical.
Track Historical Context
Monitor where the fear greed index has been historically, not just current readings. If the index has been above 70 for weeks, a drop to 60 might signal caution despite being in „greed“ territory. Conversely, a rise from 5 to 20 represents improving sentiment even while still in „extreme fear.“
Combine With Technical Levels
The fear greed index becomes more powerful when combined with technical analysis. For example, extreme fear readings at major support levels often produce strong rallies, while extreme greed at resistance levels frequently precedes reversals.
Common Questions About the Fear Greed Index
Is the Fear Greed Index Accurate?
The fear greed index accurately measures what it’s designed to measure—collective market sentiment. However, sentiment isn’t destiny. Markets can remain at extreme readings longer than rational analysis suggests they should, and contrarian signals don’t always produce immediate results.
Accuracy depends on use case. As a sentiment gauge, it’s highly accurate. As a precise timing tool, it’s less reliable. Think of it as a thermometer rather than a thermostat—it tells you the temperature but doesn’t control it.
How Often Is It Updated?
The stock market fear greed index updates daily after market close. The cryptocurrency version updates multiple times per day, reflecting crypto’s 24/7 trading schedule. This frequency makes the fear greed index suitable for both tactical and strategic decision-making.
Is It Useful for Beginners?
Yes—the fear greed index is one of the simplest ways to understand market psychology. It distills complex investor behavior into a single number that’s easy to interpret. Beginners benefit from learning to recognize emotional extremes and their contrarian implications.
However, beginners should use it as educational tool first, paper trading with fear greed index signals before risking real capital. Understanding how the index behaves across market cycles builds intuition that improves decision-making.
Conclusion: Why You Should Monitor the Fear Greed Index Regularly
The fear greed index helps answer one of the most important questions in investing: Are markets rational or emotional today? By tracking this indicator, investors can avoid panic decisions, recognize overvalued markets, spot long-term opportunities, and stay objective during volatility.
Understanding sentiment is a core part of successful investing—and the fear greed index makes it accessible to investors at all experience levels. Rather than claiming to predict the future, it simply reveals the present emotional state that so often drives short-term price movements away from fundamental values.
For investors who struggle with emotional decision-making during market extremes, the fear greed index provides an external reference point that counters psychological biases. When fear grips markets and every headline screams disaster, checking the fear greed index and seeing a reading of 5 reminds you that extreme pessimism rarely persists—and often marks opportunity.
Similarly, when euphoria reigns and market strategists compete to set higher price targets, an Extreme Greed reading serves as a useful reminder that what feels obvious and certain during bull markets often looks different in hindsight.
For ongoing market analysis that incorporates sentiment alongside fundamentals and technicals, monitoring the fear greed index daily—alongside price charts, economic data, and valuation metrics—provides a more complete picture than any single indicator alone. When evaluating specific assets like gold that respond strongly to sentiment shifts, resources like our gold carat calculator help verify physical holdings while the fear greed index helps time accumulation.
Further Reading
- CNN Business – Fear & Greed Index
- Alternative.me – Crypto Fear & Greed Index
- Morningstar – Behavioral Finance Research
- Investopedia – Sentiment Indicators
- Live Gold Price Chart
Disclaimer: This article is for educational purposes only and does not constitute financial advice. Sentiment indicators should be used as part of comprehensive analysis. Consult a licensed financial advisor before making investment decisions.