The Fear and Greed Index reveals what numbers alone cannot: whether investors are panicking or becoming complacent. This single metric, ranging from 0 to 100, synthesizes seven market indicators into one actionable signal. For gold investors, understanding when fear dominates (readings below 30) or greed takes over (above 70) provides context that price charts miss.
Markets move on emotion as much as fundamentals. This sentiment indicator doesn't predict the future, but it exposes the present—showing whether capital is flowing toward safety or chasing returns. When the index crashes into extreme fear territory, gold typically rallies as investors seek refuge. When it soars into extreme greed, gold often consolidates or pulls back as attention shifts to riskier assets.
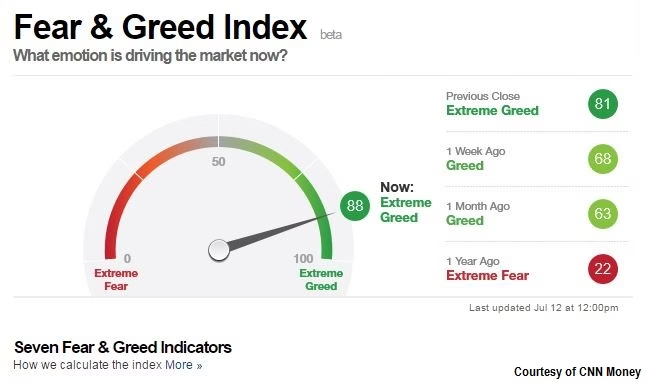
Live Fear and Greed Index Tracker
Current market sentiment updates in real-time below. Extreme readings (below 20 or above 80) warrant immediate attention, as these levels historically precede significant price movements in precious metals.
The tracker above combines stock momentum, market breadth, volatility measures, and safe-haven demand into a single reading. This consolidated approach to measuring sentiment helps identify when gold might respond to shifting investor psychology.
How Market Sentiment Affects Gold Prices
The relationship between sentiment and gold operates on a simple premise: when investors fear losses, they buy gold. When they chase gains, they sell it. This inverse relationship creates patterns that repeat across market cycles.
The Seven Components
The index aggregates data from seven distinct market measures:
| Indicator | What It Measures | Potential Gold Impact |
|---|---|---|
| Stock Price Momentum | S&P 500 vs 125-day average | Strong momentum may reduce safe-haven demand |
| Stock Price Breadth | New highs vs new lows | Weak breadth can trigger defensive buying |
| Put/Call Options | Protective vs speculative bets | High puts often correlate with hedge demand |
| Market Volatility | VIX index level | High VIX often coincides with gold inflows |
| Safe Haven Demand | Bond vs stock performance | Bond rally typically supports gold |
| Junk Bond Demand | Spreads over Treasuries | Wide spreads may signal risk-off environment |
| Market Momentum | Advancing vs declining volume | Weak momentum can drive gold accumulation |
By combining these indicators, the index filters out noise from individual data points. A single component might flash warning signs while others remain calm, but the composite reading reveals whether fear or greed actually dominates market psychology.
Reading Extreme Sentiment Signals
Sentiment data matters most at extremes. Readings between 40 and 60 suggest neutral conditions where neither fear nor greed dominates. But when the index pushes past 70 or drops below 30, history shows these extremes often precede significant moves.
Extreme Fear Territory (0-20)
When sentiment collapses below 20, panic typically grips markets. During these episodes, investors abandon risk assets regardless of valuations or fundamentals. Gold becomes a refuge not because of its yield or growth potential, but because it exists outside the financial system that suddenly feels fragile.
Historical examples illustrate the pattern:
- March 2020: Sentiment plunged to extreme fear as pandemic concerns spread. According to JM Bullion historical data, gold rallied from approximately $1,450 to above $2,000 per ounce by August 2020—a gain of over 30% in five months.
- Late 2018: Federal Reserve tightening fears drove sentiment to extreme levels. Gold bottomed near $1,240 in August 2018 and gained approximately 19% through the first half of 2019.
- August 2011: The U.S. debt ceiling crisis pushed fear readings to extreme levels. Gold spiked to then-record highs above $1,900 per ounce.
Extreme fear doesn't guarantee immediate rallies, but it identifies periods when gold's safe-haven premium tends to expand. Investors who monitor sentiment alongside price action can identify when fear creates potential accumulation opportunities.
Extreme Greed Territory (80-100)
When sentiment climbs above 80, complacency dominates. Stocks rally, volatility collapses, and investors pile into momentum trades. Gold often struggles during these periods as capital flows toward assets offering higher potential returns.
But extreme greed creates opportunity through a different mechanism—mean reversion. Markets rarely sustain euphoria indefinitely. When greed peaks and reverses, the shift back toward fear often happens quickly.
Notable instances:
- January 2018: Sentiment reached extreme greed during the tech rally. Markets corrected sharply through February and March, with the S&P 500 dropping approximately 10%.
- Early 2020: Greed readings were elevated in January-February before the pandemic crash. Gold began its major rally shortly after sentiment reversed.
Extreme greed warns when markets have priced in optimism to unsustainable levels. Patient investors use these periods to build positions, knowing that fear inevitably returns.
Integrating Sentiment Data Into Your Strategy
Understanding sentiment intellectually differs from applying it practically. Successful integration requires combining these readings with other analysis rather than trading on index levels alone.
Confirm With Price Action
Sentiment becomes most useful when it aligns with technical levels. If gold tests major support while fear rises, that confluence strengthens the bullish case. If gold rallies into resistance while greed peaks, the setup for consolidation improves.
Sentiment tells you what investors feel; price tells you what they're doing about it.
Monitor Velocity, Not Just Levels
A reading of 30 means less if it's been there for weeks than if it just crashed from 60. Rapid sentiment shifts often precede volatility spikes, while gradual drifts suggest markets are adjusting slowly to changing conditions.
The rate of change in sentiment often correlates with subsequent price volatility. Sharp drops (fear increasing rapidly) tend to precede stronger gold rallies than slow grinds lower.
Scale Position Size With Conviction
Sentiment works well as a tool for position sizing rather than binary buy/sell decisions. When readings reach extremes and align with your fundamental view, that's when to consider increasing exposure. When sentiment contradicts your analysis, that's a signal to reduce risk or stay patient.
A systematic approach to scaling:
| Index Range | Interpretation | Potential Approach |
|---|---|---|
| 0-15 | Extreme fear | Consider maximum position size if fundamentals support gold |
| 15-30 | Fear | Above-average allocation may be appropriate |
| 30-40 | Mild fear | Normal allocation |
| 40-60 | Neutral | Maintain target allocation, no tactical adjustments |
| 60-75 | Greed | Consider reducing if overweight |
| 75-100 | Extreme greed | Reduce exposure, raise cash, wait for better entry |
This framework treats sentiment as a guide for risk management, not a replacement for fundamental analysis.
What Sentiment Data Cannot Predict
The index reveals current psychology, not future events. Several critical limitations prevent it from serving as a standalone trading system.
Duration Remains Unknown
Extreme readings can persist far longer than seems rational. Fear during the 2008 financial crisis remained elevated for months while gold rallied in waves. Greed in 2017 lasted through most of the year as equities ground higher. Sentiment tells you conditions are extreme, but not when that extreme will end.
Magnitude Varies
Similar index readings produce different gold price responses depending on context. A reading of 25 during stable economic expansion might correlate with a modest rally. The same reading during a banking crisis could precede a much larger surge. Context matters as much as the number itself.
Black Swans Precede Sentiment
Major market shocks typically hit before sentiment indicators reflect them. The pandemic crash in March 2020 happened so quickly that the index lagged the initial selling. By the time extreme fear registered, much of gold's initial move had already occurred. Sentiment indicators track reactions, not catalysts.
Important research note: A 2024 academic study published in ScienceDirect found that while the Fear and Greed Index shows predictive power for equity returns, the direct statistical relationship with gold returns at the daily level is less consistent. This suggests sentiment works better as a contextual tool rather than a precise timing mechanism.
Practical Daily Workflow
Integrating sentiment into your investment process doesn't require constant monitoring, but regular checks provide context for decision-making.
Morning Check
Review the current reading alongside overnight gold price action. Note whether sentiment and price are moving in the expected direction (fear rising with gold rallying, or greed rising with gold weak). Divergences between sentiment and price often signal potential regime changes.
Weekly Tracking
Maintain a simple log recording weekly closes for both sentiment and gold prices. Over time, this historical record helps you recognize your own behavioral patterns—when you tend to get optimistic or pessimistic relative to actual market conditions.
Extreme Alerts
Set notifications for readings below 20 or above 80. These extremes deserve immediate attention even if you don't adjust positions. At minimum, reassess your thesis when sentiment reaches levels where reversals become more probable.
Correlation Analysis
Track how gold correlates with other assets during different sentiment regimes. The relationship between gold and equities, bonds, and currencies shifts depending on what's driving sentiment—understanding these patterns can improve timing.
Beyond the Index: Context Matters
Sentiment provides valuable information, but context determines whether that information translates into actionable strategy. Three factors matter most:
Fundamental Backdrop
Extreme fear during high inflation matters more for gold than extreme fear during stable prices. Psychology drives short-term moves, but fundamentals determine whether those moves become sustained trends.
According to the World Gold Council's 2025 Central Bank Survey, central banks have accumulated over 1,000 tonnes of gold annually for three consecutive years. This institutional demand creates a structural floor under gold prices that short-term sentiment cannot override.
Technical Position
Gold at major support with fear rising presents better risk-reward than gold at resistance with fear rising. Sentiment extremes gain significance when they align with technical inflection points.
Your Time Horizon
Sentiment matters more for tactical traders than long-term holders. If you're accumulating gold across decades, short-term swings create opportunities to optimize entry points but don't fundamentally alter the thesis. If you're managing shorter-term positions, sentiment extremes warrant more immediate response.
Key Takeaways
The Fear and Greed Index distills complex market psychology into a single number, making it easier to gauge whether fear or complacency dominates. This clarity helps investors recognize when sentiment has reached extremes that rarely persist—creating opportunities to buy during panic or reduce exposure during euphoria.
But sentiment works best as a confirmation tool rather than a standalone system. Combine it with fundamental analysis, technical levels, and personal risk tolerance. When these factors align with extreme sentiment readings, conviction to act increases. When they conflict, patience usually pays better than forcing trades based on index levels alone.
The live tracker above updates continuously, providing current readings alongside historical context. Use it to monitor whether today's sentiment justifies today's gold prices—and whether the crowd's emotion creates opportunity for contrarian positioning.
Sources
- CNN Business – Fear and Greed Index
- World Gold Council – Central Bank Gold Reserves Survey 2025
- ScienceDirect – Fear and Greed Index as predictor study (2024)
- JM Bullion – 20-Year Gold Price History
- Visual Capitalist – Gold's Annual Returns 2000-2025
Disclaimer: This article is for educational purposes only and does not constitute financial advice. Past performance does not guarantee future results. Consult a licensed financial advisor before making investment decisions.